Lab Partners 9/11/18 Max Bloom Aryaan Hussain
Key Question
How does time affect the distance a buggy travels when moving across a flat plane and how do the different forms of measurement (stopwatch, motion sensor and video analysis) affect this
Variables
Independent Variable - Time the buggy travels (seconds)
Dependent Variable - Distance the buggy travels (centimeters)
Controls - Buggy used, surface traveled across, person timing, and motion sensor.
Dependent Variable - Distance the buggy travels (centimeters)
Controls - Buggy used, surface traveled across, person timing, and motion sensor.
Lab Setup
|
|
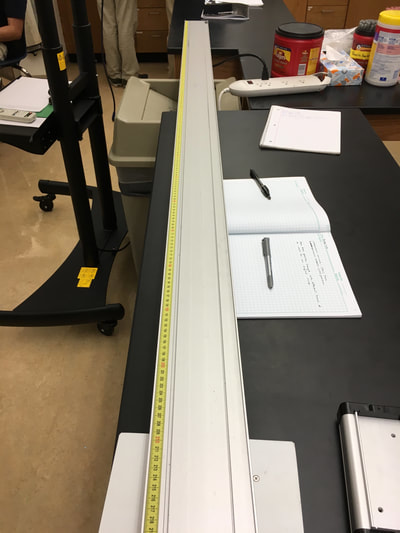
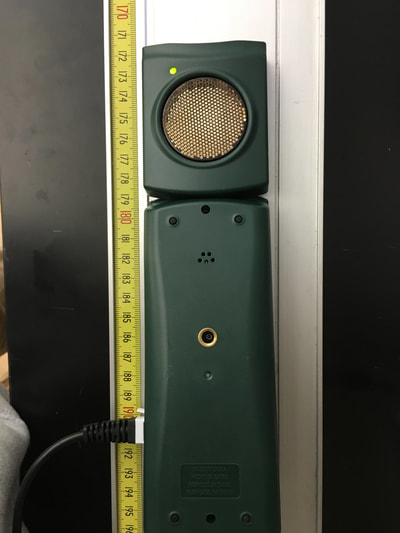
Surface that the buggy traveled across, measuring 200 cm Motion sensor we used for the 2nd form of data collection
|
Raw Data
Time | Distance 0s | 17cm 0.5s | 25cm 1s | 35cm 1.5s | 49cm 2s | 56cm 2.5s | 67cm 3s | 75cm 3.5s | 87cm 4s | 92cm 4.5s | 105cm 5s | 114cm |
Stopwatch procedure/method
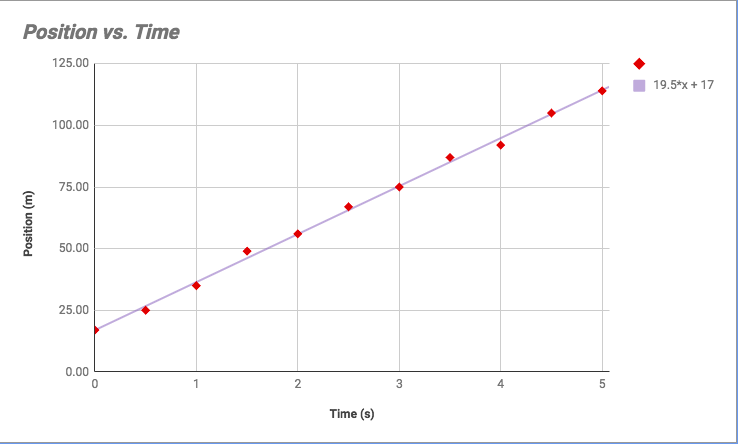
Graphical representation of the position time graph of the stopwatch method. For this method the slope tells us that for every second, the buggy travels 19.5 centimeters. The y intercept of this graph, 17, tells us that at time 0, the buggy is at 17 centimeters.
|
Motion Sensor procedure/method
- For this method of data collection by group and I used a motion detector to measure how far the buggy moved away from the motion detector.
- This can be used to see how far the buggy moves along a certain interval of time
- For this procedure, we used logger pro to measure and graph the data
- Because we used logger pro for this, raw data was not collected
- Because we used logger pro for this, raw data was not collected
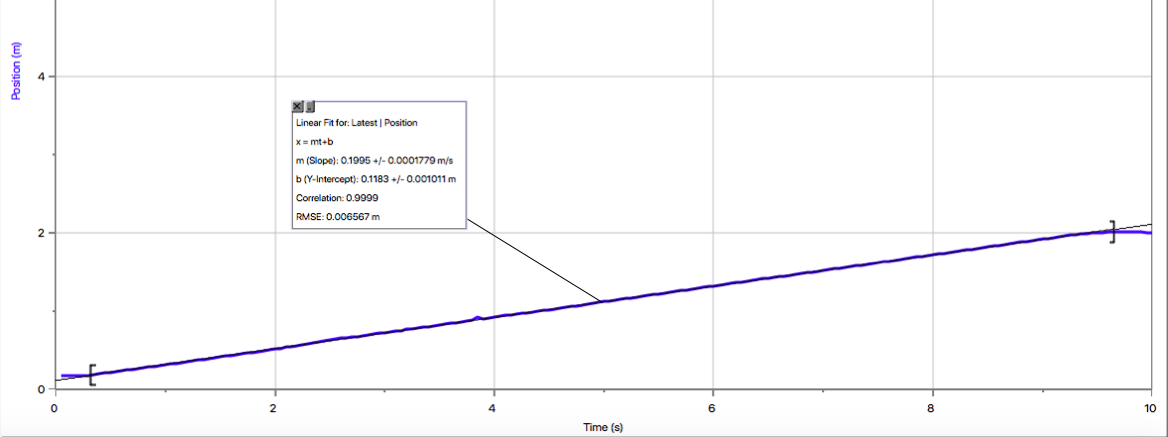
Graphical Representation for the motion sensor portion of this experiment. The slope for this graph is approximately 20cm/seconds (says 0.1995 because the motion sensor records distance in meters). The y intercept for this graph is 11.8 centimeters, meaning that, with the line of best fit, the buggy started at approximately 12 centimeters from the motion detector. The graph also has a correlation of 0.9999, meaning that there are little discrepancies in the data.
Video analysis procedure/method
- For this method we took a video of the buggy traveling across the same incline and then used logger pro to analyze it and find the relationship between time and positon
- There is no raw data for this procedure either because logger pro was used as well
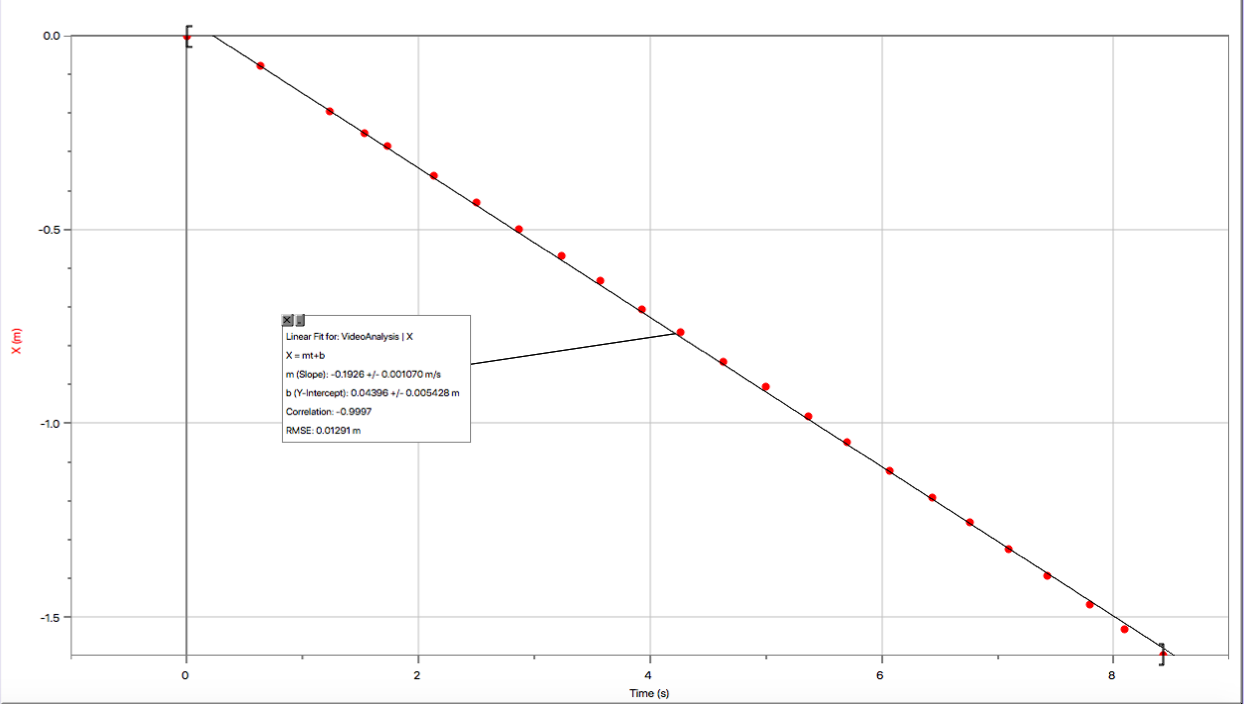
Graphical representation of the video analysis portion of this experiment. Same as the other methods, the video analysis showed us how much the position of the buggy increases with time. The slope in this graph was -19.26cm/s. This means that for every second, the buggy will travel approximately 19.26 cm. The slope is negative in this method because in the video we took the buggy was traveling from right to left, so the sign of the slope is inverted. The y intercept shows that in the line of best fit the initial position is approximately 0.04.
Strengths/weaknesses of each method
Stopwatch |
Motion sensor |
Video analysis |
|
Strengths: The stopwatch method was the easiest method to carry out, being the most basic.
Weaknesses: Especially at the lower times (under 2 seconds) there was a lot of uncertainty in the timing. This was because the person timing would need to quickly start and stop the timer in a short period of time. Furthermore, recording the position when the time hits a certain point has a lot of uncertainty in itself, as evidenced by the point's erratic deviation from the line of best fit in the graph of this method. Also, this method takes the longest because for every test run you can only record one interval of time. |
Strengths: Even though it was harder than the stopwatch to use, it was still a lot easier than the video analysis. The motion sensor also records the position on time intervals of 0.05 seconds, making it a lot more precise than a stopwatch. This precision gets rid of most of the uncertainty in this experiment as evidenced by our graph of this method.
Weaknesses: The motion sensor can only record distance on one side of the x-axis (no negative numbers). While this wasn't a problem with this experiment, this is a problem in many other situations. When using the motion sensor with logger pro, it doesn't let you delete points, so if there is a slight error when conducting the experiment you would need to start over. |
Strengths: By far the most precise out of the 3 methods, allowing you to record a data point at every single frame (with 60 frames per second this is about 66.7% faster).
Weaknesses: Video analysis is the hardest method perform. Setting up the camera so that it records the buggy at the correct angle and captures the entire surface is hard to get perfect. Furthermore, in logger pro the calibration of the scale can be difficult if the video itself doesn't have a scale you can refer to. Getting any of this wrong can counteract the aforementioned precision this method offers. |
Conclusion
Not having any complex concepts or instructions, this experiment was fairly straightforward, so the most straightforward method would be the best method to use for this experiment. The motion sensor seemed to fit this criteria the best. In addition to being easy to use, it had the smallest uncertainty out of the 3 (the video analysis would usually have the least uncertainty, but without a scale to work off of in the video, I had to estimate). The motion sensor is also the quickest method to take a large set of data for, making it the easiest to do multiple trials. Regarding the results of the lab itself, while each method had its own magnitude of limitations and uncertainty, they all pointed to a linear relationship between distance and time. All of the method's slopes were around 19 centimeters/second, which points to the fact that even with the uncertainty of each method, the results were still very accurate.
Weaknesses, Limitations, and Uncertainties
With all of the slopes of the different methods being about the same, there was actually less uncertainty than I had hypothesized. That doesn't mean that the weaknesses and limitations of the different methods don't exist; it just means that for this experiment they didn't pertain as much.
Experimental Improvements
For the Stopwatch and the motion sensor method there was not much that could be changed about the process to improve it (the weaknesses and limitations couldn't be helped). For the video analysis, however, there were many things my group and I did wrong that might have made the results more accurate:
- Having the whole surface in camera view so that the buggy can be more accurately measured
- Having some way of showing distance in the video so that there is a scale to work off of when analyzing the video
- Not taking the video from a lower and slightly tilted angle so that the points get skewed at one side
