Lab Partners 10/1/18 Max Bloom Aryaan Hussain
Key Question
How does time affect the position a cart has traveled along a ramp
Variables
Independent Variable - Time the Cart travels (seconds).
Dependent Variable - Distance the Cart travels (centimeters).
Controls - Cart used, surface traveled across, angle of incline, motion sensor.
Dependent Variable - Distance the Cart travels (centimeters).
Controls - Cart used, surface traveled across, angle of incline, motion sensor.
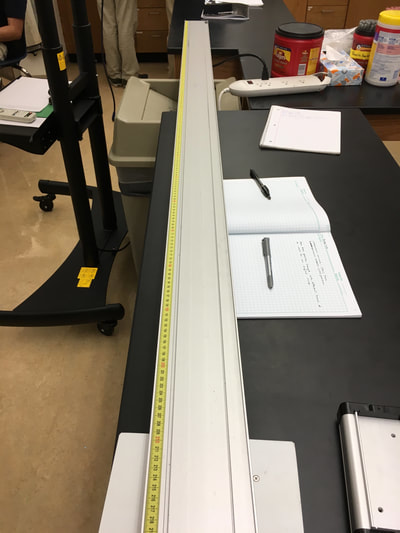
Lab Setup
|
|
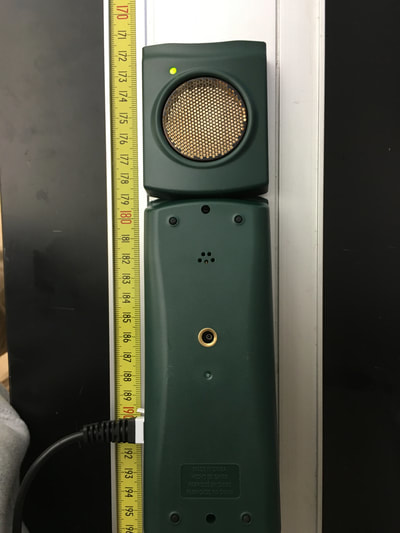
Angled Surface that the buggy traveled across, measuring 200 cm Motion sensor we used for the 2nd form of data collection
|
|
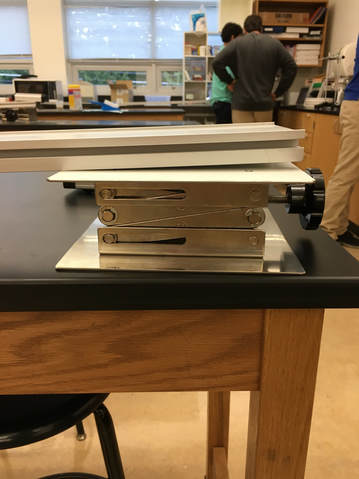
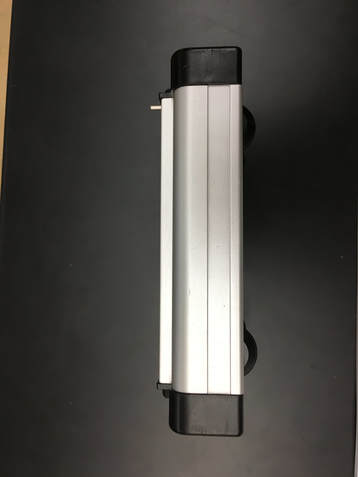
The angle of the ramp we used in this experiment The Cart we used to collect the data for this experiment
Procedure: Motion Sensor
- For this experiment my group decided to record the motion of the cart using a motion sensor
- The motion sensor records how far the cart moves away from it with the origin being directly adjacent to it
- We used the motion sensor see how far the Cart moves along a certain interval of time
- For this, we used logger pro to measure and graph the data
- Because we used logger pro for this, raw data was not collected
Position vs. Time Graph
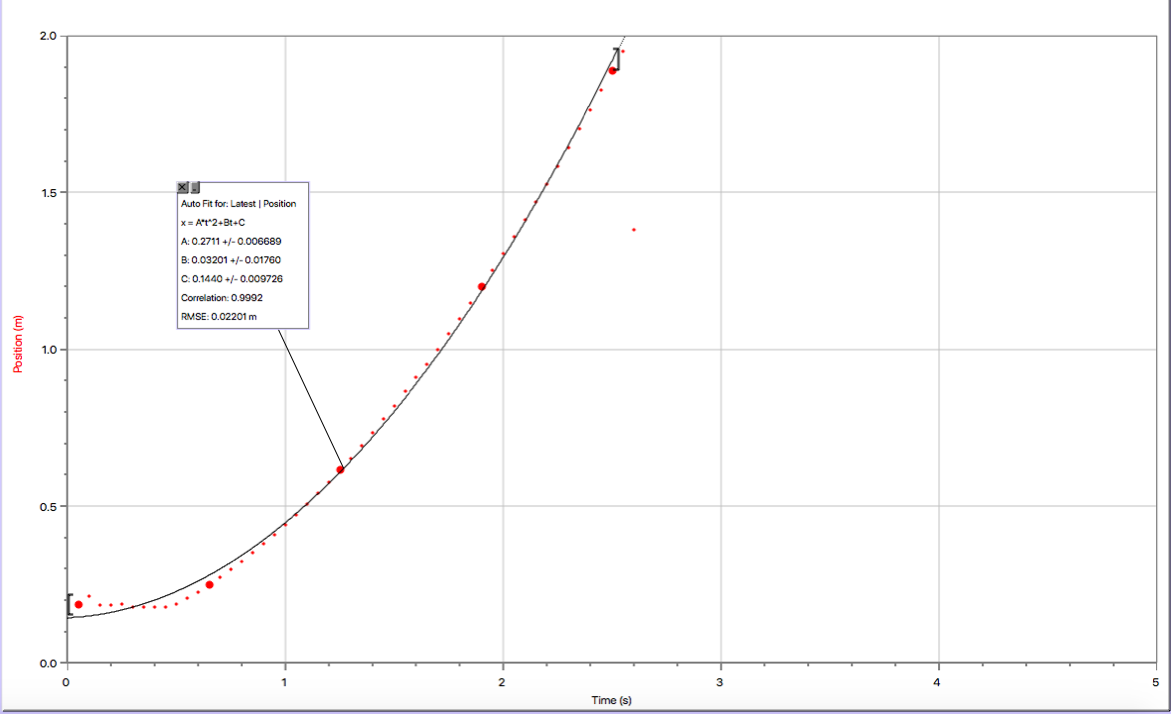
The position vs. time representation of this experiment shows a quadratic relationship between position and time of the cart in this experiment. In other words, as time goes on the rate at which position increases per time increases– the velocity time graph will give a graphical representation of this. The equation for position vs. time is:
Position (cm) = 0.2711*time(s)^2 + 0.0320*time(s) +0.1440
Position (cm) = 0.2711*time(s)^2 + 0.0320*time(s) +0.1440
Velocity vs. Time Graph
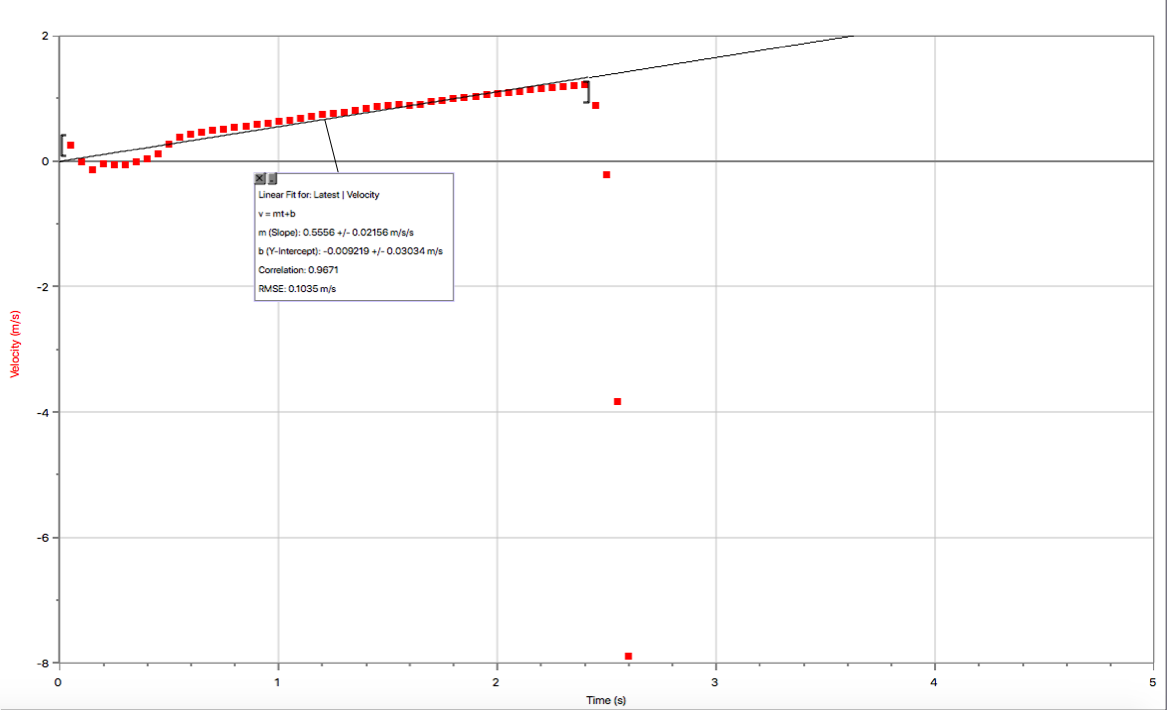
The Velocity vs. Time representation shows a linear relationship between Velocity (meters/second) and time (seconds).This supports the position vs. time graph because a concave up increasing quadratic relationship would result in a position increasing linear Velocity graph. The acceleration of this experiment would be constant with the velocity being linear. The equation of velocity vs. time is:
Velocity (m/s) = 0.5556 * time (seconds) -0.0009 (m/s)
Velocity (m/s) = 0.5556 * time (seconds) -0.0009 (m/s)
Conclusion
This lab added another aspect to the previous lab we did with the buggy. My group choose the easiest method to conduct, but it wasn't the most accurate; our graph of both position vs. time and velocity vs. time showed irregularities at the beginning and the end, which most likely influenced our data. This can most likely be attributed to our group letting the cart go after the motion sensor started. This experiment added an incline to the path traveled by the cart. With this, the velocity of the cart wasn't constant anymore. The graph of position vs. time showed a concave up increasing quadratic relationship, meaning that there is an increasing position velocity and a constant positive acceleration.
Weaknesses, Limitations, and Uncertainties
The motion sensor had the same limitations in this experiment as it did with the buggy lab; The motion sensor can only record distance on one side of the x-axis (no negative numbers). While this wasn't that much of a problem with this experiment, this is a problem in many other situations that the motion sensor can be used it. When using the motion sensor with logger pro, it doesn't let you delete points, so if there is a slight error when conducting the experiment you would need to start over. With the motion sensor it is a lot more accurate than using a stopwatch, but not as accurate as a video analysis. Uncertainties include the aforementioned human error, and the equation of the graphs being skewed by the data points at the beginning and end.
Experimental Improvements
Because of the nature of the motion sensor experiment, there was not much that could be changed about the process to improve it (the weaknesses and limitations couldn't be helped). Other than the error that was caused by my group releasing the cart later than we started the motion sensor, the experiment couldn't be improved.
