In order to prove the laws of momentum, my group and I tested various collisions in which you would expect momentum to be conserved.
Experiment 1 – Bouncy Collision (one moving, one stationary)
Credit for this diagram goes to Zach Pabis.
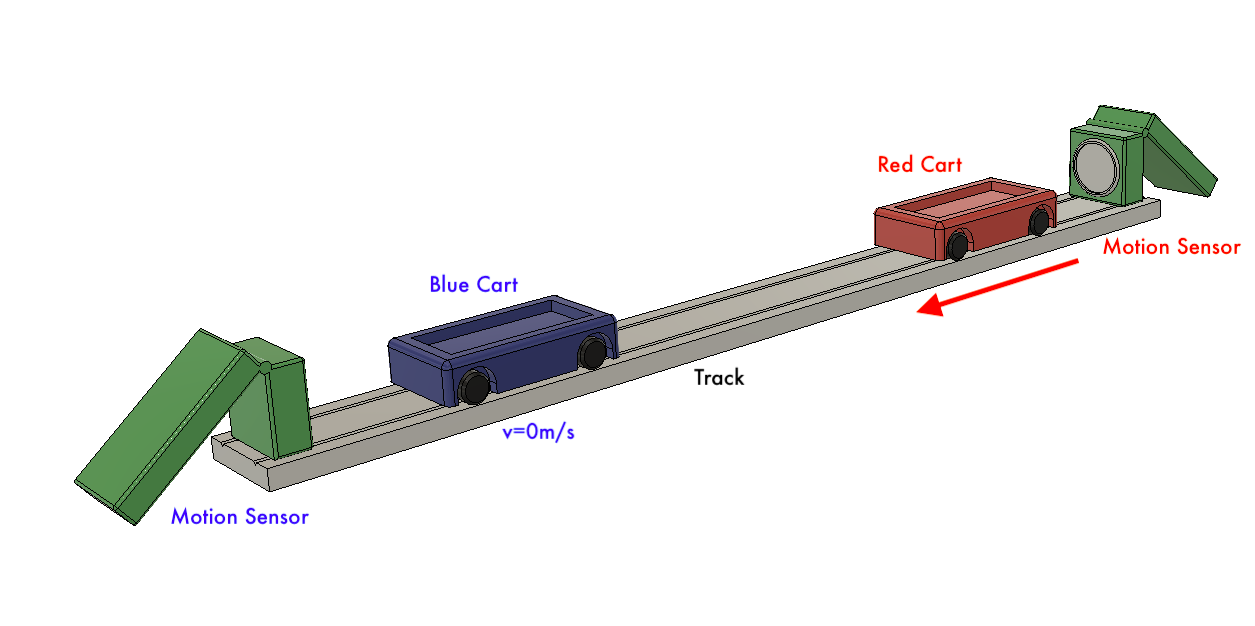
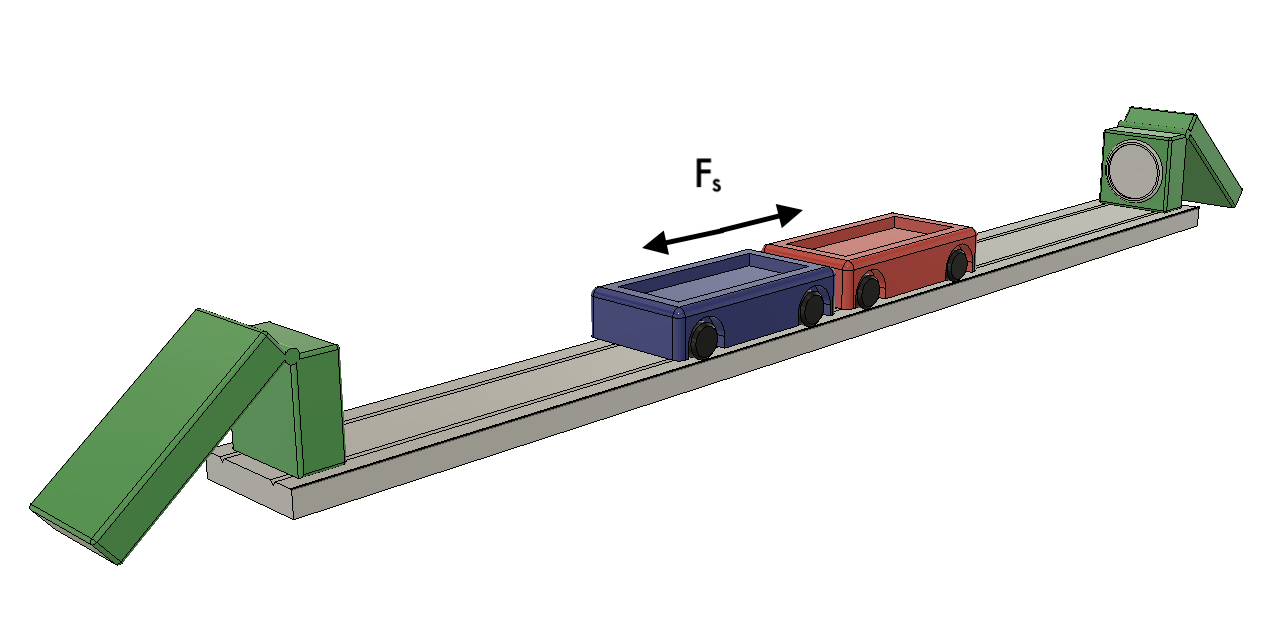
For this experiment, my group and I set up two motion sensors at both ends of a ramp. We have two carts for this experiment: the blue cart was stationary in the middle, and the red one is pushed towards it. We used the motion sensors to measure the velocities of both Carts, then I used Desmos to graph the position/time, velocity/time, momentum/time, and total momentum, using the starting position of the red cart as a reference point.
Desmos graphs
|
|
|
|
Red line is the position/time of red cart
Blue line is the position/time of the blue cart |
Dashed red line is the velocity/time of red cart
Dashed blue line is the velocity/time of the blue cart |
|
Dotted red line is the momentum/time of red cart
Dotted blue line is the momentum/time of the blue cart |
Dotted purple line is the total momentum of the system
|
Calculations and Evaluation
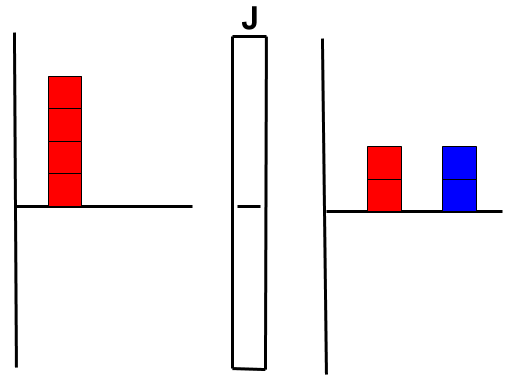
To prove that momentum is conserved in a negligibly closed system, we need to compare the velocities before and after (mass of the carts are the same, so you can discount mass). So, if you look to the graphs, you can see that the velocities are approximately the same before and after the collision, and looking to the data, we see that the initial velocity of the red car is 0.6648 m/s, and after the collision, the red car is stationary and the blue car is moving with a velocity of 0.6649 m/s.
Conservation of momentum equations:
Initial: [Red Cart Momentum] 0.25 kg * 0.6648 m/s + [Blue Cart Momentum] 0.25 kg * 0 m/s = [Total Momentum] 0.1662 kg m/s
Final: [Red Cart Momentum] 0.25 kg * 0 m/s + [Blue Cart Momentum] 0.25kg * 0.6649 m/s = [Total Momentum] 0.1662 kg m/s
Percent difference: Change in momentum = (Total Final Momentum - Total Initial momentum)/(Initial) =
(0.1662 - 0.1662)/0.1662 = 0/0.1662 = 0% error
By doing the necessary calculations, it is apparent that momentum is conserved in this experiment, thus verifying that a bouncy collisions conserves momentum. With a 0% difference between initial and final momentum, it can be concluded that momentum was transferred when the cars collided. There is likely little uncertainty in this experiment due to the lack of potential outside factors that could act on the system; the low percent difference proves this
Momentum Bar Chart -
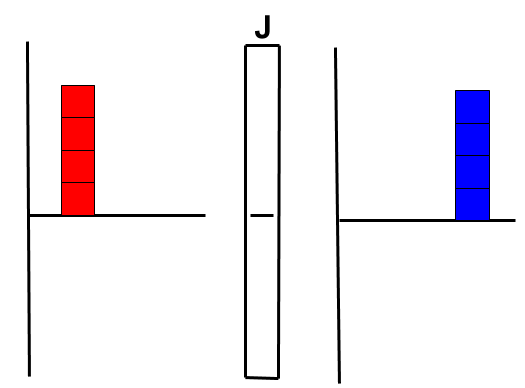
Red boxes - red cart; blue boxes - blue cart
Bouncy Collision (both moving)
Credit for this diagram goes to Zach Pabis.
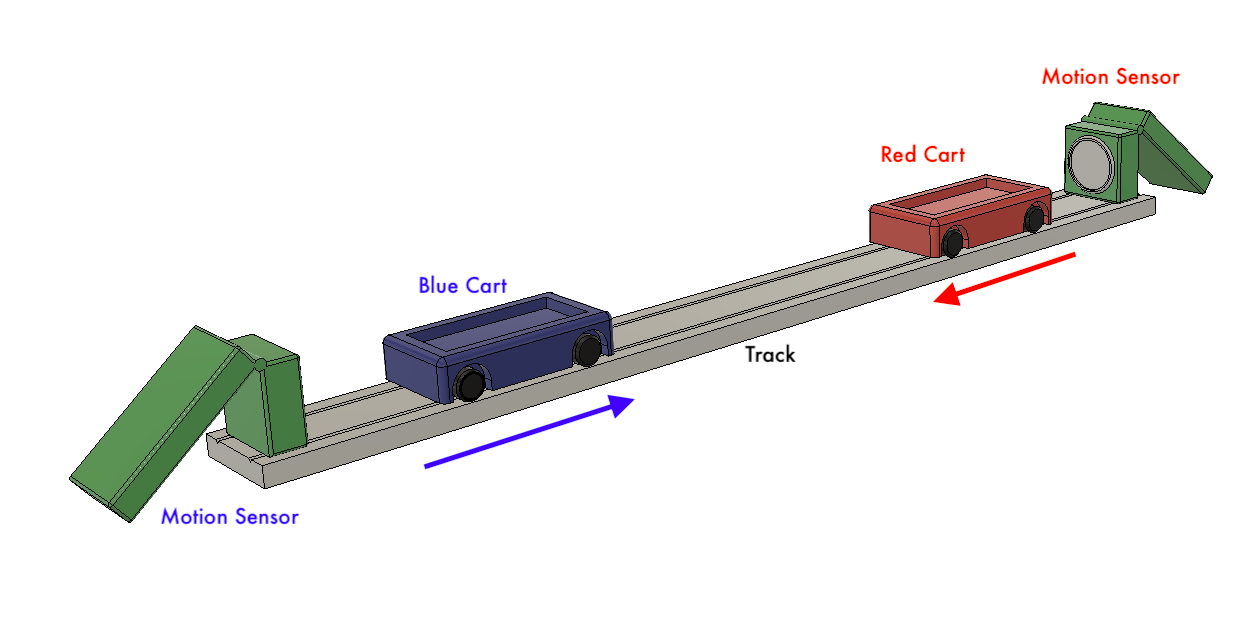
For this experiment, my group and I also set up two motion sensors at both ends of a ramp. We have two carts for this experiment: Both the blue and the red cart were pushed towards each other then bouncy off via a magnet. We used the motion sensors to measure the velocities of both Carts, then I used Desmos to graph the position/time, velocity/time, momentum/time, and total momentum, using the starting position of the red cart as a reference point.
Desmos Graphs
|
Red line is the position/time of red cart
Blue line is the position/time of the blue cart |
Dashed red line is the velocity/time of red cart
Dashed blue line is the velocity/time of the blue cart |
Dotted red line is the momentum/time of red cart
Dotted blue line is the momentum/time of the blue cart
Dotted purple line is the total momentum of the system
Dotted blue line is the momentum/time of the blue cart
Dotted purple line is the total momentum of the system
Calculations and Evaluation
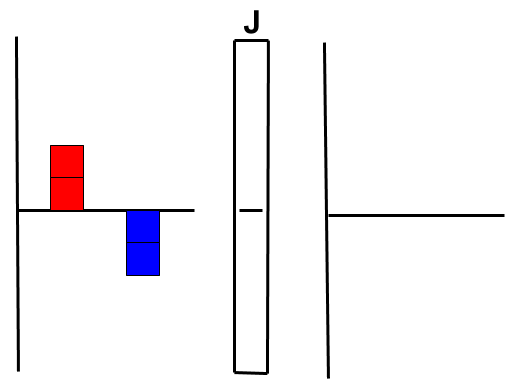
To prove that momentum is conserved in this negligibly closed system, we compared the velocities before and after (mass of the carts are the same, so you can discount mass). The graphs of velocity/time and momentum/time of the Carts show that in this experiment, momentum was seemingly lost. Calculations to prove this:
Initial: [Red Cart Momentum] 0.25 kg * 0.82 m/s + [Blue Cart Momentum] 0.25 kg * -0.72 m/s = [Total Momentum] 0.025 kg m/s
Final:[Red Cart Momentum] 0.25 kg * -0.472 m/s + [Blue Cart Momentum] 0.25kg * 0.665 m/s = [Total Momentum] 0.048 kg m/s
Percent difference: Change in momentum = (Total Final Momentum - Total Initial momentum)/(Initial) =
(0.048 - 0.025)/0.025 = 92% error
I choose to put the momentum/time and the total momentum on the same Desmos graph because that can show the loss of momentum in this experiment. Since there was no impulse in this experiment, the momentum shouldn't have dropped that much. Possible uncertainty can be attributed to the magnets used during the experiment, since they could cause a possible loss of momentum.
Momentum Bar Chart
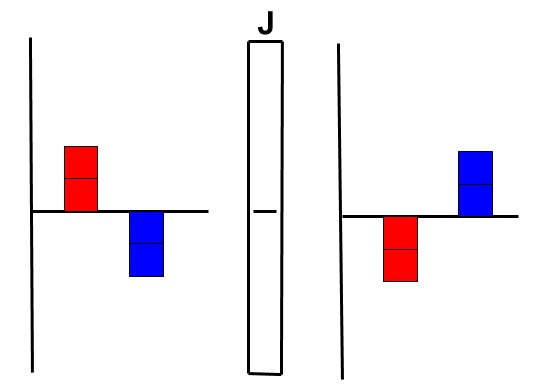
Red boxes - red cart; blue boxes - blue cart
Sticky Collision (one moving, one stationary)

Credit for this diagram goes to Zach Pabis.
For this experiment, my group and I [you guessed it!] set up two motion sensors at both ends of a ramp. We have two carts for this experiment: the blue Cart was stationary, with the sticky end facing towards the red cart, which was pushed towards it with its sticky end facing the blue car as well. We used the motion sensors to measure the velocities of both Carts, then I used Desmos to graph the position/time, velocity/time, momentum/time, and total momentum, using the starting position of the red cart as a reference point.
Desmos Graphs
|
Red line is the position/time of red cart
Blue line is the position/time of the blue cart |
Dashed red line is the velocity/time of red cart
Dashed blue line is the velocity/time of the blue cart Keep in mind the blue velocity at y = 0 for the first second |
|
Dotted red line is the momentum/time of red cart
Dotted blue line is the momentum/time of the blue cart |
Dotted purple line is the total momentum of the system
|
Calculations and Evaluation
To prove that momentum is conserved in this negligibly closed system, we compared the velocities before and after (mass of the carts are the same, so you can discount mass). The graphs of velocity/time and momentum/time of the Carts show that in this experiment, momentum was mostly conserved. Calculations to prove this:
Initial: [Red Cart Momentum] 0.25 kg * 0.806m/s + [Blue Cart Momentum] 0.25 kg * 0m/s = [Total Momentum] 0.202 kg m/s
Final: [Red Cart Momentum] 0.25 kg * 0.396m/s - [Blue Cart Momentum] 0.25kg * 0.399 m/s = [Total Momentum] 0.199 kg m/s
Percent difference: Change in momentum = (Total Final Momentum - Total Initial momentum)/(Initial) =
(0.199 - 0.202)/0.202 = = 1.49% error
The graphs for this experiment line up with what would be expected to happen if momentum is conserved. The red cart starts with a constant velocity, then once it collides with the blue car they both move at a velocity that is half the initial red velocity. Therefore, the velocities after the collision of both of the cars are the same, shown by the velocity time graph. This experiment has little opportunity for outside forces to act on it (unlike the experiment that had a magnet in it), which is proven by the low percent error.
Momentum Bar Chart
Red boxes - red cart; blue boxes - blue cart
Sticky Collision (both moving)

Credit for this diagram goes to Zach Pabis.
For this experiment, my group and I [you won't believe it] set up two motion sensors at both ends of a ramp. We have two carts for this experiment: the red and the blue cart were both pushed towards each other with differing velocities, but in this experiment they had their velcro pointed towards each other, so they stick together when they collide. We used the motion sensors to measure the velocities of both Carts, then I used Desmos to graph the position/time, velocity/time, momentum/time, and total momentum, using the starting position of the red cart as a reference point.
Desmos Graphs
|
Red line is the position/time of red cart
Blue line is the position/time of the blue cart |
Dashed red line is the velocity/time of red cart
Dashed blue line is the velocity/time of the blue cart |
|
Dotted red line is the momentum/time of red cart
Dotted blue line is the momentum/time of the blue cart |
Dotted purple line is the total momentum of the system
|
Calculations and Evaluation
To prove that momentum is conserved in this negligibly closed system, we compared the velocities before and after (mass of the carts are the same, so you can discount mass). The graphs of velocity/time and momentum/time of the Carts show that in this experiment, momentum was mostly conserved. Calculations to prove this:
Initial: [Red Cart Momentum] 0.25 kg * 0.75m/s + [Blue Cart Momentum] 0.25 kg * -0.727m/s = [Total Momentum] 0.006 kg m/s
Final: [Red Cart Momentum] 0.25 kg * 0.0134m/s + [Blue Cart Momentum] 0.25kg * 0.012 m/s = [Total Momentum] 0.00 kg m/s
Percent difference: Change in momentum = (Total Final Momentum - Total Initial momentum)/(Initial) =
(0.000 - 0.006)/0.006 = = 1% error
Both Carts started off traveling with a relatively identical velocities, and you can observe that momentum is conserved in this system because when the carts collide with each other their velocities both become 0, and thus momentum is conserved at a constant 0. With a percent error or 1, and the simplistic nature of this experiment, there is little room for error.
Momentum Bar Chart
Red boxes - red cart; blue boxes - blue cart
Explosion
Credit for this diagram goes to Zach Pabis
For this experiment, my group and I [I'm running out of creativity, you get the point] set up two motion sensors at both ends of a ramp. We have two carts for this experiment: both carts stood at rest adjacent to each other, and an internal spring-like mechanism was used to propel the carts away from each other. We used the motion sensors to measure the velocities of both Carts, then I used Desmos to graph the position/time, velocity/time, momentum/time, and total momentum, using the starting position of the red cart as a reference point.
Desmos Graphs
For all of the below graphs, keep in mind the position, velocity, and momentums at y = 0; they can be hard to see
|
Red line is the position/time of red cart
Blue line is the position/time of the blue cart |
Dashed red line is the velocity/time of red cart
Dashed blue line is the velocity/time of the blue cart |
|
Dotted red line is the momentum/time of red cart
Dotted blue line is the momentum/time of the blue cart |
Dotted purple line is the total momentum of the system
|
Calculations and Evaluation
To prove that momentum is conserved in this negligibly closed system, we compared the velocities before and after (mass of the carts are the same, so you can discount mass). The graphs of velocity/time and momentum/time of the Carts show that in this experiment, momentum was mostly conserved. Calculations to prove this:
Initial: [Red Cart Momentum] 0.25 kg * 0 + [Blue Cart Momentum] 0.25 kg * 0m/s = [Total Momentum] 0 kg m/s
Final: [Red Cart Momentum] 0.25 kg * -0.651m/s + [Blue Cart Momentum] 0.25kg * 0.892 m/s = [Total Momentum] 0.06205 kg m/s
Percent difference: cannot be calculated in this case since there was no initial momentum, and the percent different formula would thus be undefined.
the change in momentum only being 0.06205 kg m/s means that there was a small amount of uncertainty in this experiment, and that this proves the conservation of momentum. Similarly to the bouncy collision, there are more external forces at work, and thus more of a chance for uncertainty and unaccounted loss of momentum– in this case it was the initial "explosion" of the two carts. This is likely why the change in momentum in this experiment is higher than the others.
Momentum Bar Chart
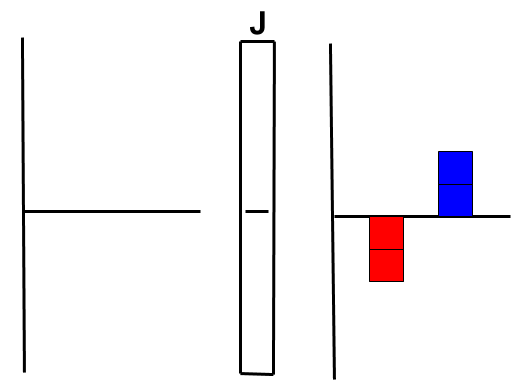
Red boxes - red cart; blue boxes - blue cart
