Learning Targets
0.01A
- I can represent any number using scientific notation. I also know what the little "E" means and why I should never write it out by hand
- E means multiplied by 10 raised to whatever number follows the E
- Never write it out because it's more clear if it's *10^x
- Scientific notation takes a big number and condenses it down to a single digit number * 10 raised to however many times you had to move over the period (if left it's positive, if right it's negative)
- examples - 157600000 = 1.576X10^8 | 0.00008655 = 8.655X10^-5
- E means multiplied by 10 raised to whatever number follows the E
0.02A
- I can convert between units and demonstrate complete mathematics using units
- When you have a unit you want to convert to another, multiply it by unit values of 1 (for instance 1kg/1000g is the same as multiplying by one) until you get the unit you want
- example - how many seconds are there in 5 days
- 5days * (24h/1d) * (60min/1h) * (60s/1min)
- when you divide all of the units out, you get 432000 seconds
- 5days * (24h/1d) * (60min/1h) * (60s/1min)
- When you have a unit you want to convert to another, multiply it by unit values of 1 (for instance 1kg/1000g is the same as multiplying by one) until you get the unit you want
0.03A
- I can interpret linear mathematical models including the meaning of slope, y-intercept, and individual points
- The x-axis on a mathematical model is the independent variable and the y-axis is the dependent variable ( f(x)=y )
- The slope is how much the y (dependent variable) goes up for every x (independent variable)
- The y-intercept is what the y is when x is 0. In experiments, it's typically the starting value of whatever you're experimenting on (mass, length, etc)
- Individual points' relation to the line of best fit of a linear graph is how much they deviate from it
- if you have small deviation, then the graph is most likely accurate.
0.04B
- I can interpret inverse or quadratic mathematical models, including the meaning of slope, y-intercept, and individual points
- Similar to Linear Graphs, the y-intercept is the y when x is 0 and is usually the starting value in experiments.
- The slope shows how the dependent variable changes when the independent variable is changed
- Inverse functions are derived when you take a function and solve for x. When graphed, the graph of the inverse function will be the original function reflected over the x=y line.
- Individual points' relation to the line of best fit of a quadratic/inverse graph is how much they deviate from it
- if you have small deviation, then the graph is most likely accurate.
0.05C
- I can take a set of data and represent on a graph with the correct model. I can interpret any mathematical model, including the meaning of slope, y-intercept, and individual points
- Same definition for the slope, y-intercept and individual points as the previous targets
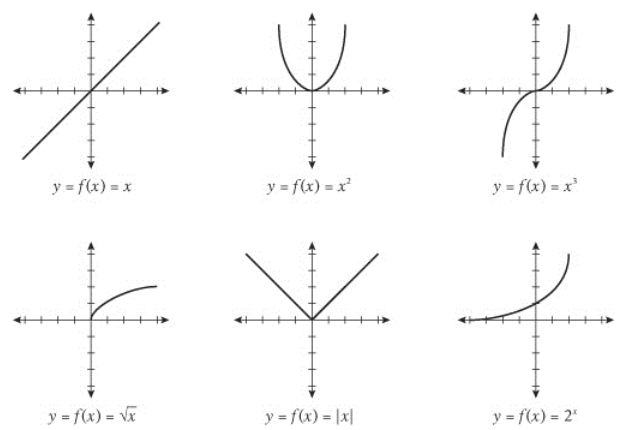
Different mathematical models
0.06C
- I understand all measurements have uncertainty. I can estimate the magnitude of this uncertainty and evaluate experimental design to reduce uncertainty.
- If one point in particular deviates a lot from the correlation of other points, it's likely due to uncertainty
- Experimental designs that leave little room for human error are optimal to reduce uncertainty
